2-minute read
How an analytics dashboard helps track progress towards accessibility goals
In 2019, plaintiffs filed more than 11,000 federal lawsuits based on alleged violations of the Americans with Disabilities Act (ADA) Title III, which prohibits discrimination based on disability in places of public accommodation. The record-high total represents a 9 percent increase over the previous year’s accessibility lawsuit tally—a 44 percent increase over the 2017 number—and covers issues ranging from inaccessible physical facilities to websites that fail to integrate with screen reader applications. Penalties can range up to $55,000 for a first violation and up to $110,000 for subsequent violations. This explosive growth in Title III–based litigation, plus the high costs thereof in terms of both fines and brand reputation, are forcing businesses across industries to take accessibility seriously, both in their physical locations and in their online properties.
Once a business has a plan in place for complying with ADA guidelines, subsequent questions begin to arise, such as How do we track our progress? How do we know which functional/geographic areas of the organization need the most attention? How do we measure where we are in terms of our compliance requirements?
This is where the accessibility analytics dashboard comes in. Before we dive into that, let’s look at the “why” behind the “what”—the business cases for ADA Title III compliance.
The business case for accessibility
While avoiding legal issues is the over-arching reason for complying with ADA Title III requirements, businesses have an additional incentive that directly impacts the bottom line. Consider the following facts from the U.S. Centers for Disease Control and Prevention:
• One in four U.S. adults—61 million people—live with a disability. In the 65+ age group, the ratio goes up to 2 out of 5.
• 13.7 percent of U.S. adults have serious difficulty walking or climbing stairs.
• 10.8 percent have cognitive disabilities—serious difficulty concentrating, remembering, or making decisions.
• 5.9 percent have difficulty hearing and 4.6 percent have difficulty seeing.
In addition, the U.S. Census Bureau estimates that by the year 2030, adults over age 65 will outnumber children for the first time in the history of the United States. As the population ages, the percentage of adults with disabilities can also be expected to increase.
Businesses often design their physical and digital properties under the assumption that 100 percent of the average user’s senses and abilities are fully enabled 100 percent of the time. But as we see in the stats above, the odds of the “average user” having a disability are higher than many of us may have thought.
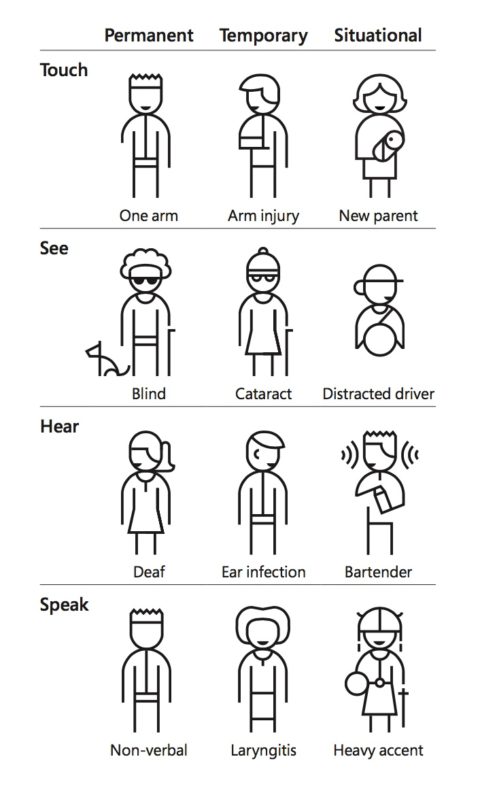
Implementing accessibility standards enables businesses to appeal to and serve a broader range of users as they want and need to be served—including those with permanent, temporary, or “situational” disabilities, as we see in this infographic from Microsoft’s Inclusive Design team

Case study: tracking accessibility initiatives in financial services
The challenge
One of our clients, an international financial services organization, had made significant investments in addressing accessibility-related concerns, both in their physical branches and in their online properties (website, mobile app, social media channels, etc). Through a company-wide awareness initiative, the executive team and the organization as a whole had become aware of the importance of complying with ADA requirements. As a next step, the organization needed a consolidated view of the progress made as an aid to determine near- and long-term areas of focus.
Our approach
Our team took a proactive approach to helping our client improve data-driven decision making by surfacing accessibility insights to enable the executive team to
• Define key performance indicators (KPIs) for actionable decision making
• Understand business requirements for the accessibility dashboard
• Design the executive dashboard concept view of accessibility insights
The process
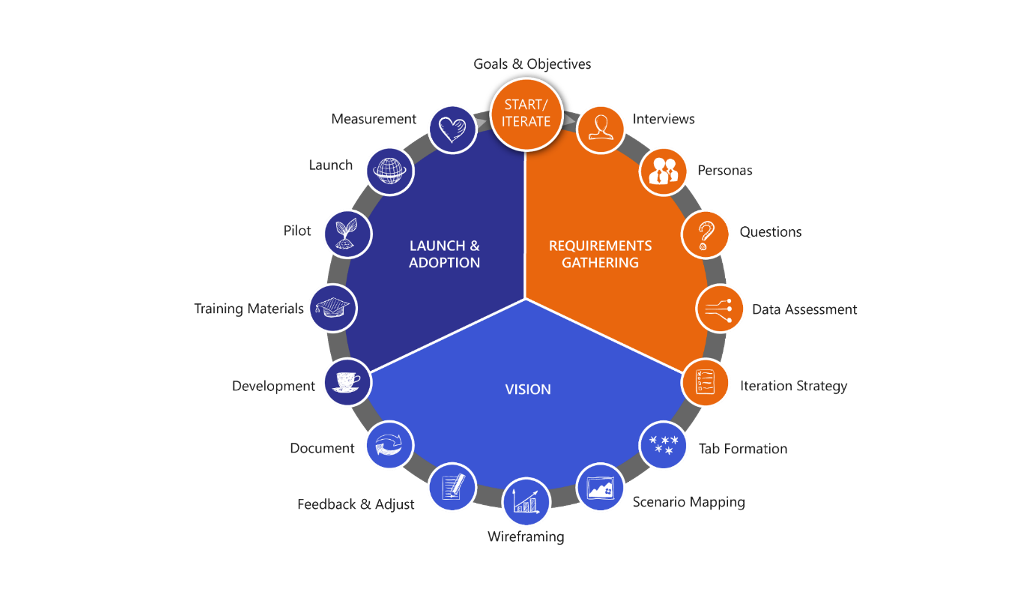
Our team worked with the client to plan and build a custom accessibility analytics dashboard, using our proven approach to delivering analytics insight as a guide:

Step 1: Requirements gathering
We conducted in-depth interviews with both stakeholders and users to clarify the specific needs of each group. Our team used this information to develop detailed user personas and build a master list of questions that the final dashboard would need to answer. We then broke the list down into smaller question groups segmented by persona to ensure that each group’s needs were addressed.
During this phase, our client told us it was important to them that the final product be able to
• Track issues for both physical and digital properties
• Incorporate new issues as they are raised by customers
• Enable individual lines of business (LOBs) and geographic divisions to focus on issues specific to their areas
By having this focus, the accessibility office and executives could determine whether issues were concerning physical or digital properties, which LOBs needed more focus more on accessibility, and which geographical regions were struggling. Providing these specifics would allow the organization to have a much more educated perspective when considering next steps.
Step 2: Vision
We wireframed the solution to minimize the need for requirements documentation while focusing on business value and outcomes. In this step, we formulated the strategy and envisioned the end state for aligning stakeholders and the business as a whole with KPIs and with the overall strategy and proposed model.
Step 3: Launch and adoption
We help users stay aligned through iterative agile development and a continued focus on user questions. Visualizations are derived directly from stakeholder goals and questions to prioritize high value and interpretability. Dashboards are performance tested and tuned throughout development to ensure efficient experiences.
The result
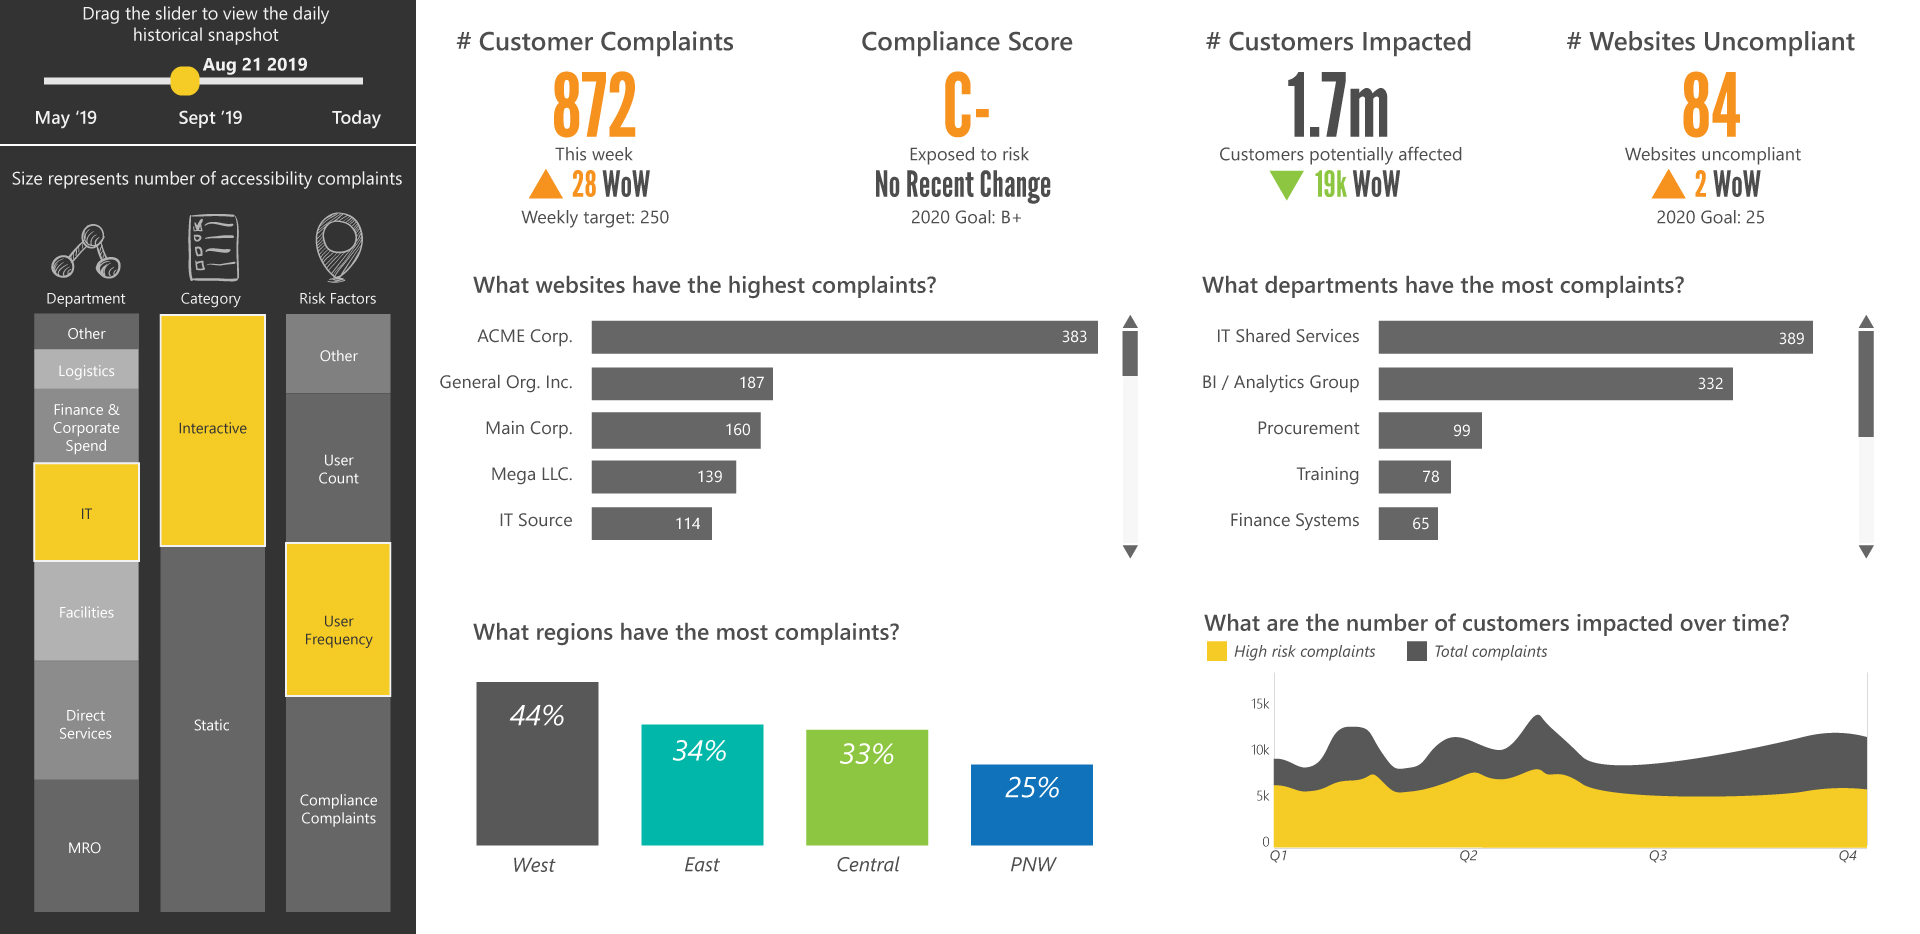
The result is a flexible, streamlined dashboard designed to let high-level users focus on the big picture while permitting tactical users to drill down on various levels and according to various criteria:

We made sure that the final dashboard not only enabled drill-downs, but also made it fast and easy for user to access those more focused views. From the opening “big picture” screen, users can click on a specific area, such as a line of business, and instantly see the more granular issues that require action on that level.
Making accessibility a daily commitment
By incorporating accessibility initiatives and goals in a flexible, user-focused accessibility analytics dashboard that’s available 24/7, businesses enable stakeholders and users to assess “how we’re doing” at any given moment of any given day. By highlighting what’s working well and what needs improvement—and why—a dashboard enables stakeholders not only to evaluate the impact of their overall efforts, but also to direct attention and budgetary dollars to the areas where they’re most needed. On a tactical level, users can access analytics specific to their areas and make any needed adjustments before small problems become larger compliance issues.
To quote Peter Drucker’s famous line, “If you can’t measure it, you can’t improve it,” and accessibility analytics dashboards deliver the focused insights organizations need to improve how they deliver on their promises to their customers—and to reap the benefits in their bottom line.
Like what you see?

Nicholas Kelly, Director of Visual Analytics at Logic20/20, has built a career on gaining business insight from data. He is a hands-on leader in analytics with over 16 years of international experience in analytics and software development, deployment, adoption, and user experience. With experience that ranges from solo coding and development to managing teams up to 25 data scientists, he knows the full analytics process and how to scale it.

Ethan Silvers, Senior Director at Logic20/20, has over 15 years of consulting experience focused on solving complex business problems through identification of critical flaws and their root causes—and the components required to achieve greater success. He has worked closely with clients in the healthcare, financial services, and tech industries, where he successfully managed numerous client relationships and projects.

