Business Intelligence Dashboards
GET A DASHBOARD
Customized data-driven insights at your fingertips
It’s no secret that data is your organization’s most valuable asset, if it’s being used strategically. When day-to-day business users have immediate access to reliable, relevant, data visualizations that help them make more informed decisions, your data can live up to its full potential and generate real ROI.
Analytics dashboards put the power of data into the hands of those who need it, unleashing the potential to:
- Heighten performance by tracking progress towards business objectives
- Improve business agility by identifying and responding to changing conditions in real time
- Discover new opportunities by improving visibility into your data
- Build a culture of data by encouraging data literacy and data-driven decision making
- Save hours previously spent chasing down information and compiling one-off reports
- Customize the data experience for each user, increasing adoption and helping build a data culture
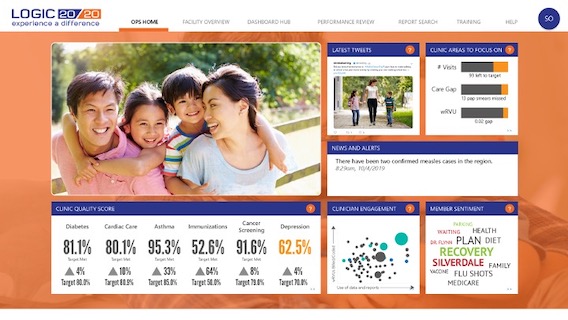
We’ll help you build analytics dashboards that are …
Data-driven
Data from across your organization is centralized into one easy-to-use tool.
Accessible
Dashboards provide a single source of truth, whenever and wherever you need it.
Current
Information updates in real time, so you never have to worry about seeing stale data.
Informative
Dashboards display the most important facts in a clear, easily digestible format.
Customizable
Figures, tables, graphs, and charts can be adapted to suit your data and your goals.
Goal-oriented
Staying on the path towards your goals is easy when you have the right information.
Business Intelligence Dashboard Delivery Process
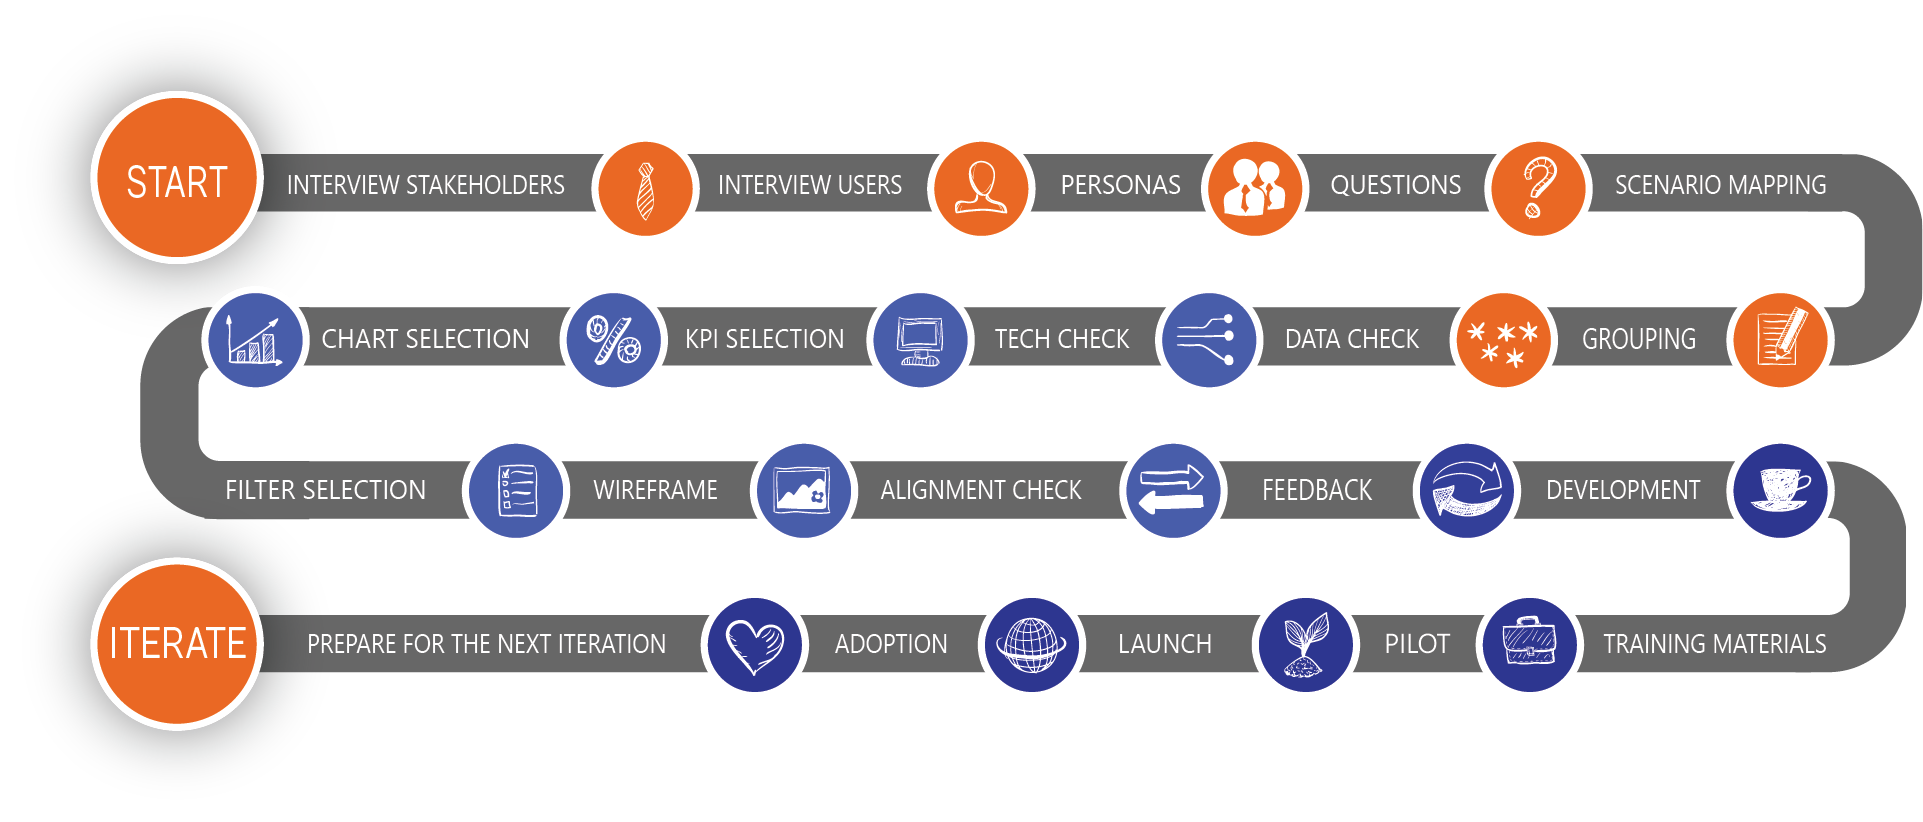
We take an iterative approach to dashboard design, improving data quality—and insights—over time. We meet you where you are, whatever state your data and analytics happen to be in today, and make the end-to-end improvements needed to get you where you want to be. Feedback and iteration loops are built in to the process, ensuring that your dashboarding system always keeps pace with changes in your data, your organization, and your strategic goals.
Who we’ve worked with
